Take the first step toward your financial goals with personalized support from Byline Bank.
When Markets Are Jumpy, Stay Focused on Your Goals

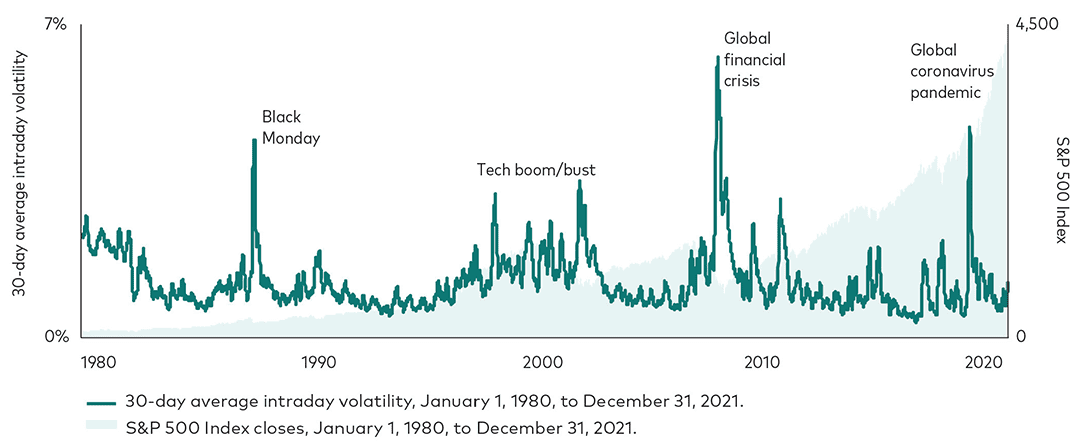
While you can’t control the markets, you can manage how you react to their swings. The key is to zoom out from any particular period and focus on the long-term trend. As you can see in the chart below, the Standard & Poor’s 500 Index, widely used as a proxy for the U.S. stock market, has been one long succession of volatile periods. However, despite the historical volatility, the index increased nearly 19 times in value during the period shown. Investors who jumped ship during the volatile times, by selling their stock portfolios, would have missed out on the impressive gains that followed the declines.
Volatility and prices for the S&P 500 Index
January 1, 1980, to December 31, 2021

Sources: Vanguard calculations, using data from FactSet.
Notes: Intraday volatility is calculated as the daily range of trading prices [(high-low)/opening price] for the S&P 500 Index.
Past performance is no guarantee of future returns. The performance of an index is not an exact representation of any particular investment, as you cannot invest directly in an index.
Volatility can also create a great opportunity to rebalance your strategic asset allocation. Volatility in the market might make it possible for you to sell concentrated equity positions or high-cost active holdings with no tax penalty. Together, we can plan for such opportunities and take advantage of them when they appear.
Both of the considerations discussed here about volatility underscore the importance of determining your financial goals and developing a plan to reach them. That plan then serves as a financial North Star—a constant, written reminder that can guide you to the outcomes you want, independent of market conditions.


